The best teams across 145 years of Test cricket - part one
A comprehensive study, taking into account teams' performances over five-year blocks, relative strength of opposition, home-away record and result margin
Anantha Narayanan
13-Jun-2021
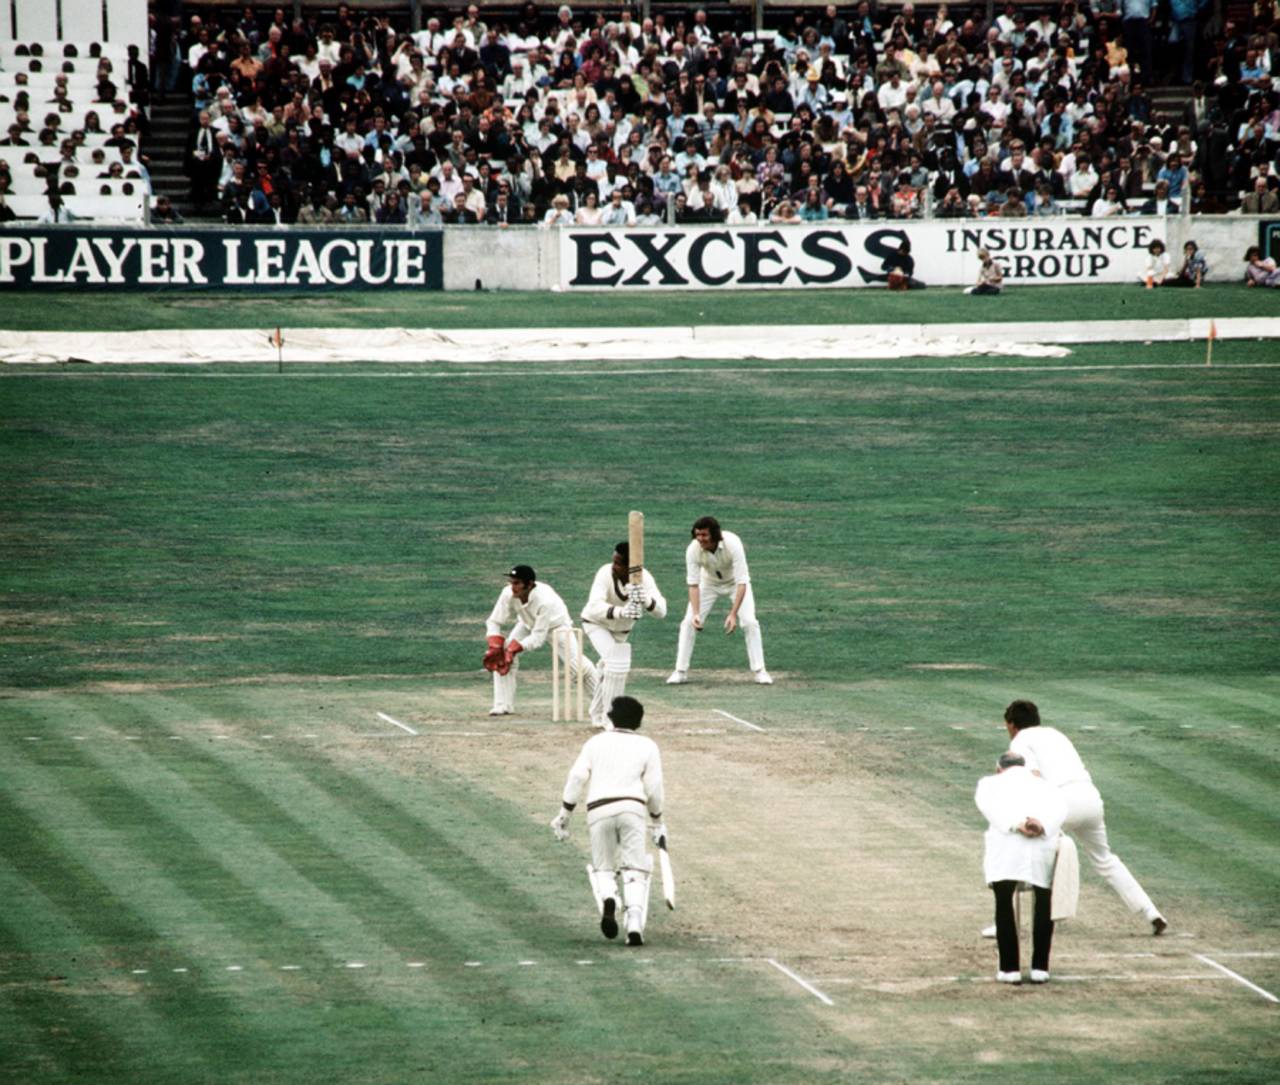
West Indies started becoming a force to reckon with in Test cricket during the era of Garry Sobers (batting) and then completely dominated the format during the time of Clive LLoyd • PA Photos/Getty Images
In this article and my next one, I will conduct a team-ratings exercise across 145 years of Test cricket. This is different from the ICC ratings. I take into consideration results, location, relative team strengths, relative team positions, and the nature of the result - win, draw, loss. I have also put in place a decaying methodology so that recent matches carry more weight.
This first article of two covers the methodology in reasonable detail and the first five periods of Test cricket, spanning 115 years from 1877 to 1991. The second article, which will be published after the World Test Championship final, will deal with the last 30 years, covering all Tests of that period, including the WTC final, and will present team analysis and conclusions.
This is a magnum opus for me since the idea has been with me for the past decade and has finally come to fruition now.
To enable the reader to understand the whole process, I have created a chart to indicate how the information flows.
Team Rating Index (TRI)
The Team Rating Index is the single value that measures how a team has performed in the previous five years. It is calculated at the end of each Test. The TRI is calculated for all teams after each Test since the distribution of Tests over the five-year period and their decay values will change for each team after every match. For the two teams playing the Test, the result of the Test is included.
The Team Rating Index is the single value that measures how a team has performed in the previous five years. It is calculated at the end of each Test. The TRI is calculated for all teams after each Test since the distribution of Tests over the five-year period and their decay values will change for each team after every match. For the two teams playing the Test, the result of the Test is included.
1. The TRI is based on the Tests played during the 60 months prior to and including the current month.
2. The 70 or so months of each of the two long World War periods are ignored in the calculations. In other words, it is as if the month before March 1946 is August 1939 (since no Tests were played during this period), and the month before December 1920 is February 1914.
3. The immediately preceding 12 months are treated at 100% weight. The full values are considered.
4. The previous 48 months are decayed gradually at a rate of 0.97153194. This value gives Tests played 60 months ago a weight of 25%, Tests played 36 months ago a weight of 50%, and Tests played 24 months ago a weight of 70.7%. This decay rewards teams whose recent results are better.
5. The Match Team Points (MTPs), explained at the end of the article, are used to determine the TRI. The decay factor is applied to the team MTPs and the maximum MTPs. A numerical example is provided at the end.
6. The suitably decayed MTP values and the maximum MTP values are accumulated and the final percentage value arrived. This value is multiplied by a constant to arrive at the TRI. The maximum value of TRI is envisaged to be 1000. To date, the highest TRI value reached is 919. A team needs to have roughly a 30-0-0 win-draw-loss or similar record to reach 1000. The nearest any team has come is 20-5-0.
7. This calculation is done for every one of the 2422 Tests for all the teams, irrespective of which two teams are playing in any given Test. Thus it is possible that, as happens in ICC ratings, a team might move up or down without playing. The results are listed at frequencies of two to three years during the pre-World War II periods, and yearly since then, as on December 31 each year. If a Test starts on December 31, it is included in the computations for the period ending that year.
8. TRI values are set at 50 if they are below 50, and at 100 if they are between 50 and 100. This happens often during the initial years.
Given below are a couple of examples of the TRI calculation.
Take the date December 31, 2006. The last match for the year is the South Africa-India Boxing Day Test. Let us look at how Australia performed as on that date. In the previous 60 months (since January 1, 2002), Australia played 62 Tests and had an excellent 47-8-7 (win-draw-loss) record. Of these 62 Tests, ten were played in 2006 and carry 100% weight. The previous 52 Tests carry a weight ranging from 100% to 25%. Australia received a total of 119.9 MTPs (decayed) during this period; the corresponding maximum value (also decayed) is 204.7. Using these two values, the percentage between them and a multiplication factor, Australia's TRI is determined to be 878. They topped the table as on that date.
Let us take a mid-year date, for instance, June 24, 1982, and look at West Indies' TRI as on that date. They had played 33 Tests, with a good-but-not-great record of 10-19-4 during the previous five years, and had secured 40.9 points as against a possible maximum of 107.7. The combination of these two numbers and the multiplication factor sets the TRI value for West Indies at 570. A fairly low value for first position. Four teams were bunched together at the top of the table on that date.
It can be seen that the TRI values are, by design, capped at 1000. This may seem to be comparable to the ICC's rating system, although by now it should be clear that there is no comparison. The other explanations are provided at the end of the article.
Let us move on to the first period - before World War I. The graphs show the top three teams for each year considered. The names of the teams placing second and third are provided along the bar in each instance, going from left to right.
This is a difficult period to analyse. Test matches were few and far in between. There were years with only two or even no Tests. Hence it is not worthwhile doing an annual team ratings. I have split these 37 years into 11 analysis periods for the purpose of this exercise. The first year considered here is 1883, six years after the first Test. This period started with Tests between Australia and England; South Africa joined in 1889 and they were quite weak to start with. So one could say that this period was dominated by Australia and England and they shared the spoils, with Australia marginally ahead.
Australia started well, leading the first ratings table, and England finished well. Towards the end of this period, England had Sydney Barnes, inarguably the best bowler during the first 70 years of Test cricket. England had Jack Hobbs and Herbert Sutcliffe early in the 20th century. If one looks at the rating points, England went past 700 a few times and Australia once. Between 1885 and 1888, England had seven straight series wins, home and away. This golden period should tip the scales in favour of England in this phase of the game's history, though Australia had the edge in table leads. And these England results were achieved through the efforts of some extraordinary bowlers, led by George Lohmann to start with, and then Barnes after the turn of the century.
In the second period, more Tests were regularly played and three new Teams - New Zealand, West Indies and India - entered Test cricket. Unfortunately most teams in this period were cannon fodder for the strong Australian and English teams. It is also true that these teams did not play among themselves. In this phase too I have selected certain years, as opposed to all of them, partly based on the number of Tests played. There are 14 such rating years out of 19.
Australia started strongly after the First World War. They won the first six Tests against England and drew the next two, reversing England's strong end to the previous phase. Australia picked up bushels of rating points and finished first, and continued to do so for the next five years or so, until England started winning - despite the fact that a gentleman named Don Bradman had started his career. England had a good run thanks to Wally Hammond, Hedley Verity, and Harold Larwood.
As Bradman began to move mountains, Australia hit back, and after Bodyline, they recovered the initiative and finished the 1930s strongly. They were helped by very good players, like Bill O'Reilly, Stan McCabe and Lindsay Hassett, who complimented Bradman's brilliance. Since then Australia have always been a force, barring a period during the 1980s. They led the tables frequently, topping nine times against England. During the first 70 years of Test cricket, Australia led 15 times and England ten. South Africa managed to edge Australia out of second place twice.
One could say that the seeds for Australia's overall dominance were planted before World War II and flourished after the war. Their already strong team was strengthened by new players like Sid Barnes, Arthur Morris, Keith Miller, Neil Harvey and Ray Lindwall. Bradman's decision to continue his career while in his late 30s meant that Australia swept everything before them in the first few post-war years. That disputed catch by Jack Ikin when Bradman was batting on 28 in the first post-war Ashes Test, in Brisbane in 1946-47, was to prove significant. Australia won eight series after the post-war resumption, and Bradman's retirement in 1948 did not stop the juggernaut.
Australia's dominance lasted for about seven years after the war. The TRI values speak of how far ahead of the rest Australia were during these years. They topped the 900 mark for the first time in 1949. In the 1950s, there was a shift: for two years, South Africa - with a devastating pace attack led by Neil Adcock and Peter Heine, and a good batting line-up led by Jackie McGlew - took over. Their ascension to the top at the end of 1954 was the first time a team other than Australia or England had led the table. Then England took over. They had very good batting, led by Len Hutton, Peter May and Colin Cowdrey, but the real match-winners were their bowlers, Jim Laker, Fred Trueman and Brian Statham. England had a three-year reign at the top. Australia changed their leader to the charismatic Richie Benaud, and they regained top spot for the last three years of this period. Norman O'Neill, Alan Davidson and Bobby Simpson provided excellent support to Benaud.
Australia dominated this period, topping the table 11 times. England followed with three, and South Africa spoke for the other teams with a historic first place in 1954. West Indies showed that they were an emerging team with quite a few appearances in the top three.
The highest ever TRI value was reached in this period. At the end of the fourth Test of the Ashes in Australia in 1950-51, in Adelaide, when Australia reached 919 TRI points, they had a magnificent sequence of 25 Tests over the previous five years in which they won 20 and drew five, securing 49.3 out of 80.4 MTPs. Australia's results against each team during this period were as follows: England 11-3-0, South Africa 4-1-0, India 4-1-0 and New Zealand 1-0-0. To boot, in two of the draws, Australia were in winning positions. The winning teams were led by Bradman, to start with, and Hassett. This Adelaide Test, despite being a mid-year one, has been featured as a special entry in this graph.
Having shown their strength towards the end of the previous period, West Indies now went on to finish top of the table for six consecutive years, starting 1962. One of the greatest players ever, Garry Sobers, was the kingpin, and the three Ws were accompanied by fearsome pace bowlers and a spinner in Lance Gibbs. They won not just at home but on the road as well. England topped in two of the next three years and then, led by Raymond Illingworth, took over for the next three. However, Australia finished the period strongly, with four straight years at the top. The team was helmed by the brilliant Ian Chappell, who had very good players like Dennis Lillee, Jeff Thomson, Greg Chappell and Doug Walters in his side. The way Australia demolished strong teams like England and West Indies during this time was remarkable. India, through their 1971 exploits, managed to get to a high third place on December 31, 1972. The year 1968 in this phase is an interesting one: the top three teams were within nine points of each other at the end of it.
For once, a period was not dominated by Australia. West Indies led in six years, Australia in five and England in four. West Indies were driving home a message that fast bowlers would rule the roost, often even in the subcontinent. Clive Lloyd had just taken over the reins and the pace-dominated attacks were to hold sway for some time to come; and the master, Viv Richards, had launched his mercurial career.
(An addition based on a couple of early feedback mails: without in any way justifying the abhorrent Apartheid policies, it must be said that South Africa were the strongest team during the late sixties, and their exit was a huge loss to Test cricket. At the end of the last Test played before they left the scene (against Australia in March 1970), South Africa were well placed with 696 TRI points and were actually on top of the table. This recognises their performances during the period 1965-70. Unfortunately, they then dropped off, although they maintained their second position for a few Tests afterwards. It can be seen that even in the year-end table for 1970, they are second. This is because only six Tests were played in 1970. Of course, when they came back in 1992, it was as if it was a new team entering.)
England started the second half of 1970s quite well and had a run of three years on top. Australia, who were on top in the first year of the period, were about to go into their worst phase ever. The Packer desertions were proving to be tough to handle. Then West Indies had one year at the top. The next year, 1982, is the only year in which two teams - West Indies and a strong Pakistan, led by Imran Khan - tied for first place, with 570 points each. Pakistan played more Tests and won and lost more matches than West Indies, who had a much higher share of drawn matches. After this blip, West Indies moved back up to the top in 1983.
This launched one of the most heart-warming phases of domination ever. Thanks to Richards, Gordon Greenidge, Desmond Haynes, Michael Holding, Andy Roberts, Malcolm Marshall, Joel Garner, and Lloyd himself leading effectively, West Indies had a straight run of nine years at the top - from 1983 to 1991. They went 29 consecutive series unbeaten, between 1980 and 1994. However, unlike latter periods of domination by teams, there were quite a few draws in this period, especially when West Indies were on the road. Many teams competed for second place, and for the first time ever, New Zealand secured that spot no fewer than three times. West Indies never finished lower than second. Pakistan were among the top three almost always during this period.
West Indies led the table in 10.5 of the 15 years, while England, with three table-topping positions, came in next. Australia led in one year and Pakistan shared the lead in one. Ominously for West Indies, in the 1991 ratings they and Australia were separated by a single TRI point - 631 to 630.
A summary of the first 115 years of Test cricket
During the first 70 years, there was no cricket for 11 years due to the World Wars. Also, no Tests were played in 1878, 1891 and 1900. Over this span, I have not considered 31 years because too little cricket was played in each of them. Thus we have tables for 25 years. Since World War II, we have tables for every year starting from 1947. Hence there are a total of 70 tables. The distribution of the table-leading positions is:
During the first 70 years, there was no cricket for 11 years due to the World Wars. Also, no Tests were played in 1878, 1891 and 1900. Over this span, I have not considered 31 years because too little cricket was played in each of them. Thus we have tables for 25 years. Since World War II, we have tables for every year starting from 1947. Hence there are a total of 70 tables. The distribution of the table-leading positions is:
Australia: 32
England: 20
West Indies: 16.5
South Africa: 1
Pakistan: 0.5
England: 20
West Indies: 16.5
South Africa: 1
Pakistan: 0.5
This is on expected lines. Australia dominated every period, barring the last one, where they were marginally behind. England were second almost always, barring the last period. West Indies were dominant in the '60s and utterly so during the late '80s. South Africa managed to break the sequence, as did Pakistan. I can guarantee that the next two periods are very exciting as new teams break into the winners' enclosure.
In the second article of this analysis, I will cover the last 30 years of Test cricket up to and including the WTC final. I will also feature the teams that had consistently high TRI values. I will have team graphs covering the entire history of Test cricket.
Finally, I will do a special analysis that determines the best team in the history of Test cricket. This will involve massive calculations for each Test played by the eight top teams, going back between 10 and 20 years at each point. It will involve well over a million values, from which I will then calculate the best stretch for a team. I will be using the TRI points to do this work.
Supporting data
Decaying methodology
Let us say there are two sequences of results with the same set of MTPs, but in different order. Team A has MTP values of 4.5, 4.3, 2.5, 1.0 and 0.2 (recent results first). Team B's values are 0.2, 1.0, 2.5, 4.3 and 4.5. The weights for each of these Tests are 1.0, 0.9, 0.8, 0.7 and 0.6 respectively. Without decay, the average for the two teams will be the same - 12.5/5 = 2.5. The overall performance % will be 12.5/25.0 = 50%.
Let us say there are two sequences of results with the same set of MTPs, but in different order. Team A has MTP values of 4.5, 4.3, 2.5, 1.0 and 0.2 (recent results first). Team B's values are 0.2, 1.0, 2.5, 4.3 and 4.5. The weights for each of these Tests are 1.0, 0.9, 0.8, 0.7 and 0.6 respectively. Without decay, the average for the two teams will be the same - 12.5/5 = 2.5. The overall performance % will be 12.5/25.0 = 50%.
Let us now decay the values. Team A has an overall % of 55.9 (4.5*1.0 + 4.3*0.9 + 2.5*0.8 + 1.0*0.7 + 0.2*0.6) / (5.0*1.0 + 5.0*0.9 + 5.0*0.8 + 5.0*0.7 + 5.0*0.6). Team B has an overall % of 44.0 (0.2*1.0 + 1.0*0.9 + 2.5*0.8 + 4.3*0.7 + 4.5*0.6) / (5.0*1.0 + 5.0*0.9 + 5.0*0.8 + 5.0*0.7 + 5.0*0.6). Note how effectively Team A's recent very good results have given them a significantly higher (by 12%) rating value. Both teams have identical results but in different order and that is an important distinction. Of course, the decay here is steep - running from 1.0 to 0.6 in five Tests - since I was explaining the concept. For my analysis, I use a decaying factor of 0.97153194. Why this odd number, one may ask. It is because 0.97153194^48 = 0.25. Thus I achieve 25% weight for the oldest month (the 48th month previous).
Match Team Points (MTP)
These points are allotted to the two teams that played any given Test. These are allotted with a maximum value of 5.0. The components are:
These points are allotted to the two teams that played any given Test. These are allotted with a maximum value of 5.0. The components are:
Result: Maximum - 2.5 points (2.5 for a win, 1.5 for a tie, 1.25-0.50 for 4/3/2-innings draws and low to very low values for matches in which not even one innings was completed.
Location-Result/ Team Strength/ Team Ratings: Maximum - 2.0 points. This is a complex collection of factors. In summary: the Location-Result is a combination with ten discrete values (Tie + 3 locations x 3 results), which are used to determine the base values. In summary, more points get allocated if there is an away win, the team strengths are way apart, and the team rating points are way apart (with the weaker team winning).
Team Performance: Maximum - 0.5 point. This is based on the Team Performance Points, explained later. 0.5 points are shared between the two teams if the total TPP is 100. If it is lower than 100 points, there is proportionate sharing.
In summary, the result gets an allocation of around three points (60% - 2.5 points directly and 0.5 points indirectly) and the other factors, around two points (40%). Given below are a few Tests with their MTPs to explain the methodology. I have selected high, middling and low MTP values.
High MTP values: The highest MTP value was achieved by Afghanistan when they defeated Bangladesh away, by 224 runs in 2019. They received 4.82 points. This comprises 2.5 (max-2.5) for the win, 0.35 (max-0.5) for the TPP of 71.7 (224-run win) and 1.97 (max-2.0) for the away win, and the huge difference in team strengths and team rating points. In 1888, Australia defeated England by 61 runs in a low-scoring game and secured 4.60 MTPs. This comprises 2.5 for the win, 0.35 for the TPP of 69.4 and 1.75 for the away win and fair difference in team strengths (a somewhat weak Australia) and team rating points. In 1952-53, South Africa defeated Australia by 82 runs and secured 4.55 MTPs. This comprises 2.5 for the win, 0.28 for the TPP of 57.9 (somewhat narrow win) and 1.77 for the away win, significant difference in team strengths (a strong Australia) and team rating points.
Medium MTP values: For the first tied match in 1960-61, West Indies got 2.58 MTPs. This was a tie and Australia were comfortably ahead of them on TRPs. For this match, Australia secured 2.36 MTPs. For a close draw between Pakistan and Sri Lanka in Faisalabad in 1981-82, Sri Lanka received 2.48 MTPs and Pakistan, 1.65 points. Sri Lanka gained because they were new to Test cricket and Pakistan were considerably stronger and well placed in team ratings.
Low MTP values: When Australia were mauled by an equally strong England by 675 runs in 1928-29, in Bradman's debut Test, they deservedly got 0.07 MTPs. Zimbabwe's MTP tally for their huge innings loss at home in 2005 against a middling New Zealand was 0.09.
Team Performance Points (TPP)
These points are based on a complex performance analyses of the scores. A detailed description of the process will take too much space. It is a "contribution" exercise jointly undertaken by me and Milind Pandit. Suffice to mention that a complex five-stage allocation process allocates points for a match, teams, innings, functions and players. We move from the match level in a top-down approach. The overall guidelines and the cornerstones of allocation are given below.
These points are based on a complex performance analyses of the scores. A detailed description of the process will take too much space. It is a "contribution" exercise jointly undertaken by me and Milind Pandit. Suffice to mention that a complex five-stage allocation process allocates points for a match, teams, innings, functions and players. We move from the match level in a top-down approach. The overall guidelines and the cornerstones of allocation are given below.
All results, excluding the double-declaration farce in Centurion in 2000 and The Oval forfeiture by Pakistan in 2006 will get allocated 100 points. The two teams playing a tied match will be allocated 50.0 TPP each. These are considered as results.
Drawn matches will get allocations below 100, depending on the extent of progress of the match. The points allocated range from 99.8 to 0.4. The team which is ahead in the match will get more points. This ensures that bat-athons are put in their place.
All innings wins are allotted 75 or more points. However, depending on the margins and match scoring patterns, wins by runs could get more than 75 points.
The actual point allocations depend on the scoring patterns in the Test. Two five-wicket wins may get differing points allocations. A win by an innings and 100 runs (in a low-scoring match) could get more points than a win by an innings and 200 runs (in a high-scoring match).
A few point allocations are provided below:
50.0 : 50.0 for a tie (for the two tied Tests)
50.1 : 49.9 for a one-run win (West Indies-Australia in 1993)
58.1 : 41.9 for a five-wicket win (Pakistan's five-wicket win against Ireland)
90.6 : 9.4 for a win by an innings and 198 runs (Australia against Pakistan in Sharjah)
94.2 : 5.8 for a 675-run win (England against Australia in Brisbane)<
50.6 : 49.2 for the draw with scores level and nine wickets down (India versus West Indies in Mumbai)
43.4 : 30.9 for a three-innings draw (New Zealand vs Sri Lanka in Wellington)
0.3 : 0.1 for a ten-ball draw (West Indies versus England at North Sound).
Email me your comments and I will respond. This email id is to be used only for sending in comments. Please note that readers whose emails are derogatory to the author or any player will be permanently blocked from sending any feedback in future.
Anantha Narayanan has written for ESPNcricinfo and CastrolCricket and worked with a number of companies on their cricket performance ratings-related systems