A deep analytics dive into the Warriors-Cavaliers rematch
They're a combined 24-1 in the playoffs. Their rosters include 11 players who have appeared in an All-Star Game. They've been on a collision course to a third straight NBA Finals. Who has the edge: the Warriors or Cavaliers? Let's look at the numbers.
NBA Finals preview
They're a combined 24-1 in the playoffs. Their rosters include 11 players who have appeared in an All-Star Game. And they've been on a collision course to a third straight NBA Finals matchup. The Warriors and Cavaliers are set to do battle, but who has the edge by the numbers? BY LUKE KNOX
Starter RPM rankings
The Cleveland Cavaliers and Golden State Warriors both have star power, but which players can be counted on to make a big offensive or defensive play in the Finals? Let's rank the 10 starters by both offensive and defensive Real Plus/Minus, a stat measuring a player's net point differential per 100 possessions. Also included: league percentiles in Points Per Play for all plays, to see strengths and weaknesses.
Excellent
Good
Below Avg
N/A
Offensive RPM
▼
▼
Off. percentiles
▼
▼
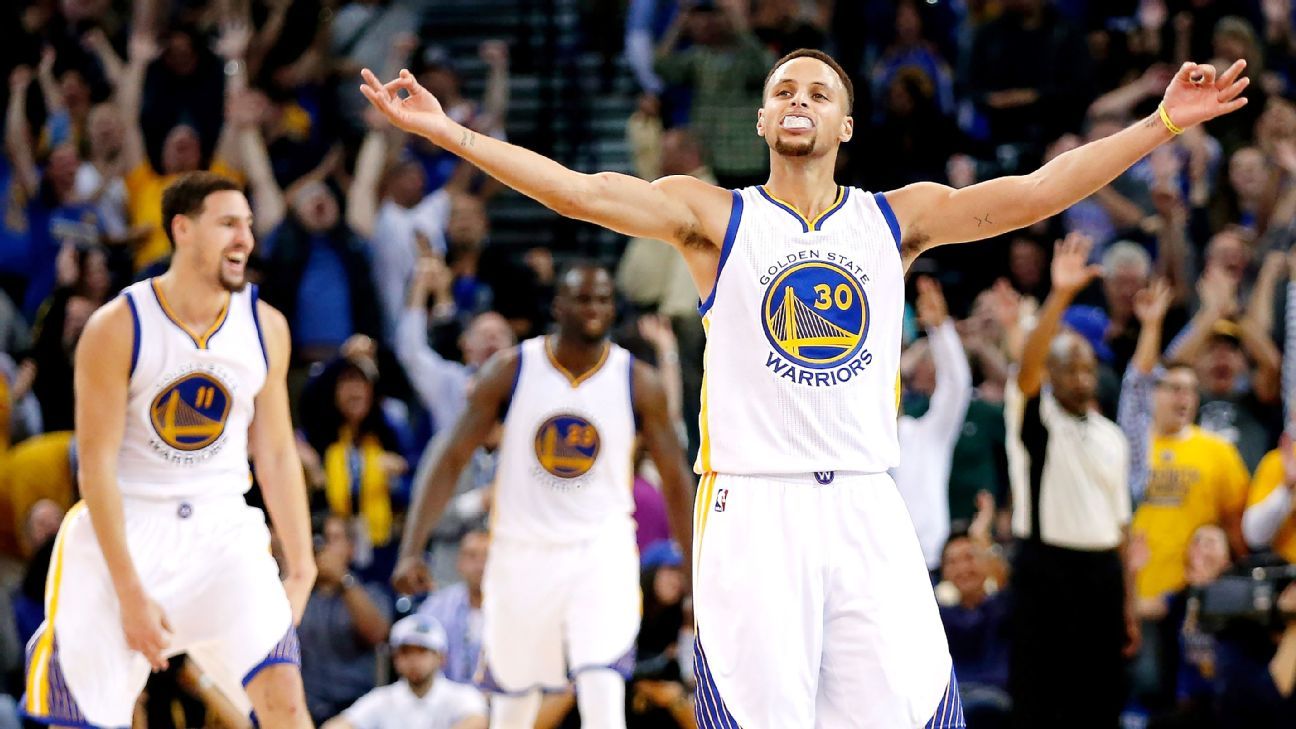
1Stephen
Curry
Curry
7.05

| Transition | 69 |
| Isolation | 93 |
| P&R, ball handler | 78 |
| P&R, roll man | 85 |
| Post-up | |
| Spot up | 97 |
| Handoff | 86 |
| Cut | 39 |
| Off screen | 91 |
| Putbacks | 45 |
| Misc. | 77 |

2 LeBron
James
James
6.18

| Transition | 71 |
| Isolation | 77 |
| P&R, ball handler | 84 |
| P&R, roll man | 96 |
| Post-up | 72 |
| Spot up | 66 |
| Handoff | 30 |
| Cut | 94 |
| Off screen | 20 |
| Putbacks | 85 |
| Misc. | 40 |
3Kevin
Durant
Durant
4.25

| Transition | 91 |
| Isolation | 89 |
| P&R, ball handler | 85 |
| P&R, roll man | 57 |
| Post-up | 55 |
| Spot up | 95 |
| Handoff | 88 |
| Cut | 91 |
| Off screen | 84 |
| Putbacks | 99 |
| Misc. | 83 |
4Kyrie
Irving
Irving
4.15
| Transition | 59 |
| Isolation | 95 |
| P&R, ball handler | 83 |
| P&R, roll man | 7 |
| Post-up | 78 |
| Spot up | 85 |
| Handoff | 73 |
| Cut | 96 |
| Off screen | 85 |
| Putbacks | 6 |
| Misc. | 70 |
5Klay
Thompson
Thompson
2.92

| Transition | 71 |
| Isolation | 95 |
| P&R, ball handler | 75 |
| P&R, roll man | |
| Post-up | 19 |
| Spot up | 88 |
| Handoff | 27 |
| Cut | 72 |
| Off screen | 70 |
| Putbacks | 30 |
| Misc. | 98 |

6Kevin
Love
Love
2.70

| Transition | 55 |
| Isolation | 51 |
| P&R, ball handler | |
| P&R, roll man | 22 |
| Post-up | 45 |
| Spot up | 90 |
| Handoff | |
| Cut | 75 |
| Off screen | 83 |
| Putbacks | 36 |
| Misc. | 85 |
7Draymond
Green
Green
1.57

| Transition | 22 |
| Isolation | 5 |
| P&R, ball handler | 16 |
| P&R, roll man | 15 |
| Post-up | 9 |
| Spot up | 47 |
| Handoff | |
| Cut | 57 |
| Off screen | 22 |
| Putbacks | 12 |
| Misc. | 8 |

8Zaza
Pachulia
Pachulia
-0.28

| Transition | 92 |
| Isolation | 14 |
| P&R, ball handler | |
| P&R, roll man | 72 |
| Post-up | 18 |
| Spot up | 17 |
| Handoff | |
| Cut | 39 |
| Off screen | |
| Putbacks | 21 |
| Misc. | 10 |
9J.R.
Smith
Smith
-0.60

| Transition | 52 |
| Isolation | 28 |
| P&R, ball handler | 1 |
| P&R, roll man | 1 |
| Post-up | |
| Spot up | 41 |
| Handoff | 6 |
| Cut | |
| Off screen | 84 |
| Putbacks | |
| Misc. | 74 |
10Tristan
Thompson
Thompson
-1.52

| Transition | 73 |
| Isolation | |
| P&R, ball handler | |
| P&R, roll man | 79 |
| Post-up | |
| Spot up | |
| Handoff | |
| Cut | 33 |
| Off screen | |
| Putbacks | 43 |
| Misc. | 41 |
Defensive RPM
▼
▼
Def. percentiles
▼
▼
1Draymond
Green
Green
5.12
| Transition | |
| Isolation | 72 |
| P&R, ball handler | 82 |
| P&R, roll man | 86 |
| Post-up | 82 |
| Spot up | 89 |
| Handoff | 51 |
| Cut | |
| Off screen | 69 |
| Putbacks | |
| Misc. |
2Zaza
Pachulia
Pachulia
3.68
| Transition | |
| Isolation | 23 |
| P&R, ball handler | 54 |
| P&R, roll man | 18 |
| Post-up | 42 |
| Spot up | 79 |
| Handoff | |
| Cut | |
| Off screen | 14 |
| Putbacks | |
| Misc. |
3Kevin
Love
Love
2.01
| Transition | |
| Isolation | 46 |
| P&R, ball handler | 55 |
| P&R, roll man | 28 |
| Post-up | 64 |
| Spot up | 79 |
| Handoff | 69 |
| Cut | |
| Off screen | 48 |
| Putbacks | |
| Misc. |
4 LeBron
James
James
1.69
| Transition | |
| Isolation | 52 |
| P&R, ball handler | 66 |
| P&R, roll man | 76 |
| Post-up | 84 |
| Spot up | 93 |
| Handoff | 26 |
| Cut | |
| Off screen | 72 |
| Putbacks | |
| Misc. |
5Tristan
Thompson
Thompson
1.65
| Transition | |
| Isolation | 68 |
| P&R, ball handler | 27 |
| P&R, roll man | 62 |
| Post-up | 56 |
| Spot up | 67 |
| Handoff | 15 |
| Cut | |
| Off screen | 17 |
| Putbacks | |
| Misc. |
6Kevin
Durant
Durant
1.19
| Transition | |
| Isolation | 78 |
| P&R, ball handler | 50 |
| P&R, roll man | 89 |
| Post-up | 64 |
| Spot up | 89 |
| Handoff | 26 |
| Cut | |
| Off screen | 59 |
| Putbacks | |
| Misc. |
7Stephen
Curry
Curry
0.42
| Transition | |
| Isolation | 50 |
| P&R, ball handler | 38 |
| P&R, roll man | 67 |
| Post-up | 81 |
| Spot up | 59 |
| Handoff | 87 |
| Cut | |
| Off screen | 42 |
| Putbacks | |
| Misc. |
8Klay
Thompson
Thompson
-0.44
| Transition | |
| Isolation | 34 |
| P&R, ball handler | 59 |
| P&R, roll man | 1 |
| Post-up | 77 |
| Spot up | 80 |
| Handoff | 70 |
| Cut | |
| Off screen | 74 |
| Putbacks | |
| Misc. |
9J.R.
Smith
Smith
-0.91
| Transition | |
| Isolation | 51 |
| P&R, ball handler | 25 |
| P&R, roll man | |
| Post-up | 0 |
| Spot up | 86 |
| Handoff | 11 |
| Cut | |
| Off screen | 19 |
| Putbacks | |
| Misc. |
10Kyrie
Irving
Irving
-2.24
| Transition | |
| Isolation | 12 |
| P&R, ball handler | 19 |
| P&R, roll man | 20 |
| Post-up | 62 |
| Spot up | 18 |
| Handoff | 14 |
| Cut | |
| Off screen | 89 |
| Putbacks | |
| Misc. |
Playoff dominance from LeBron
Any way you slice it, LeBron James has played absurdly well in the playoffs: 32.5 points, 8.0 rebounds and 7.0 assists per game, not to mention a 30.4 player efficiency rating, 126 offensive rating and .299 Win Shares per 48 minutes (last postseason, he was at .274). Using the Game Score metric, with which 10 is average and 30 is very good, James has ratcheted up the production in a big way -- his playoff rate of games with a 30-plus Game Score eclipses Russell Westbrook's from this season.
Game Score totals (30+ in blue)
Click/hover for details
Percentage of games with 30+ Game Score
Green playing his best defense
For the Warriors' defense, everything starts and ends with the versatility and excellence of Draymond Green. His success with controlling traffic and slowing LeBron James are crucial for the Warriors. Comparing all starters' Defensive Win Shares per 48 minutes to the stellar number for Rudy Gobert (the DWS leader this season), it's clear that Green is operating on another level.
Key numbers
47.4
Field goal percentage for the Cavaliers on plays after timeouts, best in the NBA and better than the team's overall percentage of 47 percent. Their PPP (1.01) on such plays are second, behind only Houston (1.017). Golden State is fifth in points per play following timeouts (0.963) and tied for second in field goal percentage (46.9 percent, worse than their overall mark of 49.5 percent).
19.3
Points per game off turnovers for the Warriors, a league high. By comparison, the Warriors had 17.1 points per game off TOs last year en route to 73 wins. Cleveland was tied for 26th this season at 14.6 per game, down from 16.3 last season.
+8.6
Net rating for Cleveland's bench in the playoffs, a huge improvement from their regular-season total of minus-1.3. Deron Williams (+16.4 in playoffs) leads the way. Golden State's bench was plus-7.4 in the regular season, and plus-7.8 in the postseason, spearheaded by JaVale McGee (+26.3).
45.5
Field goal percentage for Draymond Green in the final two minutes of the fourth quarter or overtime -- the best for any player from either team with at least 30 attempts. That's better than LeBron James (43.8), Kyrie Irving (43.2), Stephen Curry (42.3) and Kevin Durant (42.2).
How they got here
In their 50-10 start, the Warriors were winning at an .833 clip. Remarkably, since then they are playing even better (29-5, .853 winning percentage). Cleveland had a solid plus-261 point differential in 82 regular-season games, then cruised to a plus-177 in just 13 playoff games. Their running totals:
Click/hover for details
Transition vs. Iso-ball
The teams are miles apart when comparing points per play against play frequency for various plays. Golden State is all about fast breaks (a league-high 18.5 percent are in transition). Cleveland thrives on isolation, averaging 0.99 points per play while running isolation plays a league-high 11.9 percent of the time. The Warriors screen you to death (13 percent of plays, compared to 5.2 for Cleveland).
Click/hover for details
Curry, Irving leaders in longevity
Stephen Curry endured three losing seasons after being drafted in 2009, but the Warriors grew into a destination for veterans seeking a ring (Durant, West, Pachulia). Irving and Tristan Thompson also suffered three sub-.500 seasons before James returned in 2014 and a handful of trades (Love, Smith, Frye) reconfigured the roster. Here's how each current roster was built:
Starter
Key reserve
Key reserves are those with at least 10 minutes per game during playoffs.

This season: a thriller and a blowout
The teams met twice this season, with each winning in a different fashion. In the Christmas Day matchup, Cleveland had a 3.4 percent win probability with 8:17 left (trailing 95-82) and 5.9 percent with 46 seconds left. But Kyrie Irving hit a fadeaway jumper with 3.4 seconds on the clock to cap the comeback. In the second meeting, Golden State's WP never dipped below 98.4 percent the entire second half in a 35-point rout. The Warriors hit 15 3-pointers and outrebounded the Cavs 58-35.
Similarities in Four factors
The teams are more evenly matched than you might think offensively -- all their teams' ranks in Dean Oliver's Four Factors are no more than two spots from each other (they rank 1-2 in effective FG pct.). In terms of weaknesses, the Warriors are 29th in defensive rebounding (74.9%, league average is 76.7) and the Cavs are 29th in defensive turnover percentage (11.4%, average is 12.7).
Warriors
Cavaliers
Who will win the rematch?
All things considered, the numbers point to the Warriors claiming the NBA Finals rubber match. And those numbers are pretty one-sided -- ESPN's Basketball Power Index sides with Golden State by a huge margin.
93%
BPI chances of the Warriors beat the Cavaliers to win the championship
Photos by Ezra Shaw/Getty Images (Curry) and Brian Spurlock/USA Today Sports (Irving). Stats courtesy of Synergy Sports Tech, Basketball-Reference.com, Inpredictable.com, NBA.com and ESPN Stats & Information.