Ryan ten Doeschate on the top!
A detailed look at the top allrounders in ODI cricket based on their batting and bowling skills
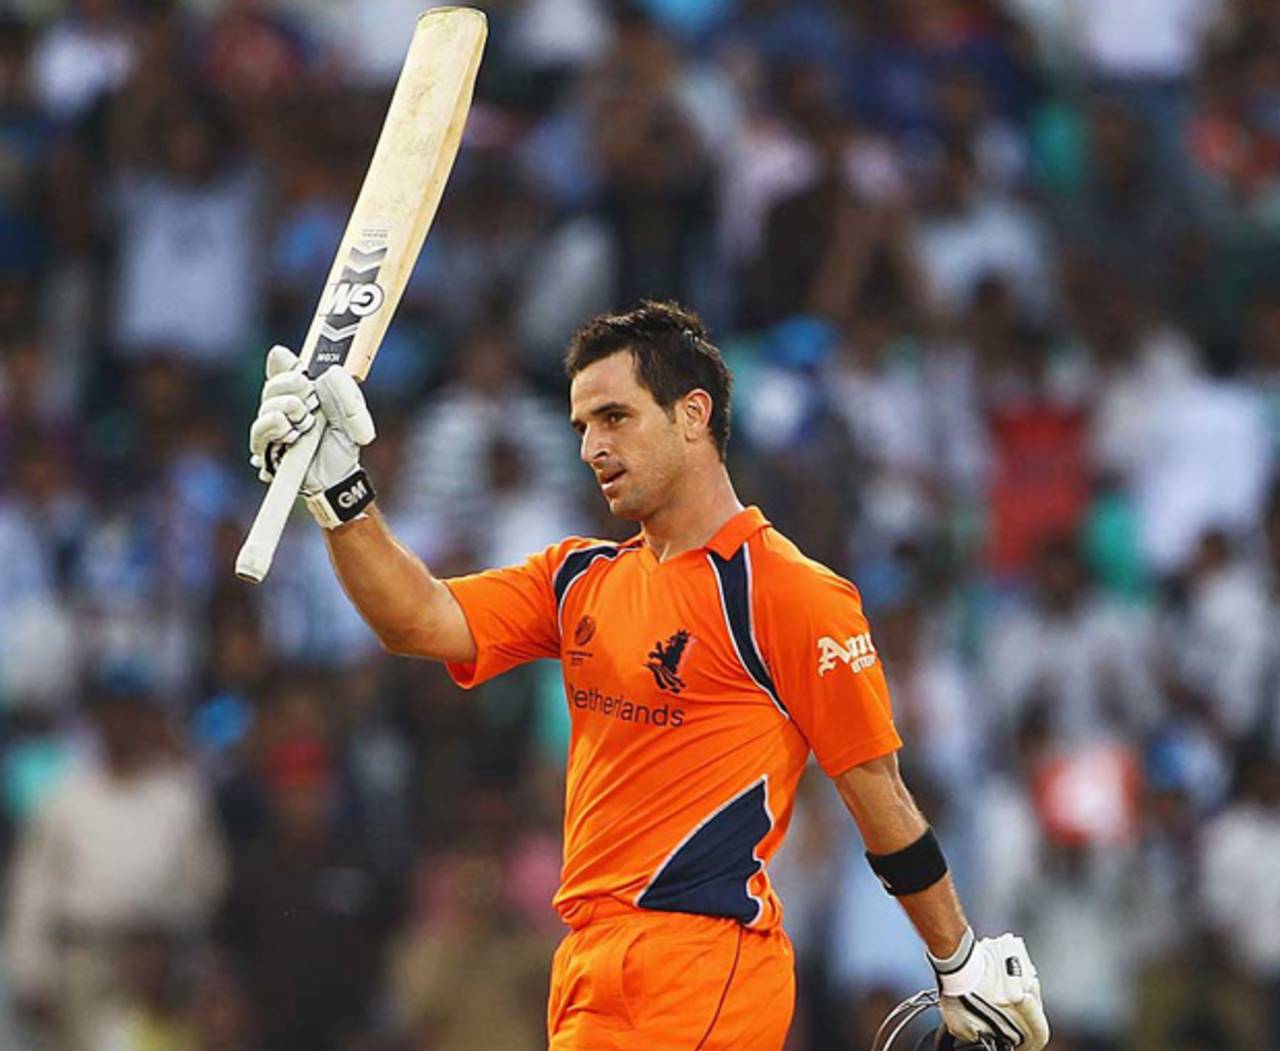
Ryan ten Doeschate has an impressive record as an allrounder in ODIs. • Getty Images
I started looking at the work I had done over the years and found out that I had never really done an article on ODI allrounders. Test allrounders, plenty, but almost nothing on ODI allrounders. So I decided to complete this gap in my bio-data.
There is no doubt that ODI allrounders analysis is a specialised area requiring a deeper level of analysis than the Test exercise. Wickets are paramount in Tests and a 6 for 75 is invariably considered to be better than 5 for 50. However in ODIs with the bowlers bowling for a limited number of overs, an analysis of 2 for 20 is almost always more effective than 3 for 40 or 4 for 60. Also a 50-ball 30 is more likely to win a match than 75 in 90 balls. These are true in most situations. I agree that defending a low total or chasing a middling score would promote the importance of wickets and runs. Hence it is essential to give due weight to all four facets of batting and bowling.
As normally happens, the first step is to draw up a minimum cut-off point. With lofty ideas I started with 100 wickets and 2500 runs to find that not many qualified. I progressively lowered the bar and finally decided on 50 wickets and 1500 runs. These numbers represent an average playing career of 40-50 matches and would allow the players from the 1980s and associate countries to be considered. There were 65 qualifying players, which is a fair number.
How does one measure the all-round ability of an ODI allrounder? I decided on the following measures.
1. A composite career-level ratings of the four measures: Batting RpI, Scoring rate, Bowling Strike rate and RpO.
3. The trusted AllRounder (A-R) ratio of Batting RpI / Bowling average.
2. A run-equalised delivery per match measure.
4. Run-equalised values for career. This is strictly a longevity measure and is meant to recognise the allrounders who played a huge number of matches.
I will also show a final table classifying allrounders into bowler-centric, balanced and batsman-centric groups.
Let us now move on to the tables.
| Name | Ctry | ODIs | RpI | Sc/R | St/R | RpO | RpI-Idx | Sc/R-Idx | St/R-Idx | RpO-Idx | A/R-Index |
|---|---|---|---|---|---|---|---|---|---|---|---|
| RN ten Doeschate | Ned | 33 | 48.15 | 87.7 | 28.72 | 5.04 | 24.08 | 20.10 | 26.11 | 14.88 | 85.17 |
| A Flintoff | Eng | 141 | 27.81 | 88.8 | 33.27 | 4.40 | 13.90 | 20.36 | 22.54 | 17.06 | 73.86 |
| SR Watson | Aus | 160 | 34.25 | 88.5 | 36.34 | 4.78 | 17.12 | 20.28 | 20.64 | 15.68 | 73.72 |
| IVA Richards | Win | 187 | 40.24 | 90.2 | 47.83 | 4.49 | 20.12 | 20.67 | 15.68 | 16.69 | 73.16 |
| V Sehwag | Ind | 251 | 33.76 | 104.3 | 45.75 | 5.26 | 16.88 | 23.91 | 16.39 | 14.25 | 71.43 |
| DS Lehmann | Aus | 117 | 30.47 | 81.3 | 34.48 | 4.84 | 15.23 | 18.64 | 21.75 | 15.50 | 71.13 |
| KJ O'Brien | Ire | 72 | 28.89 | 83.3 | 34.13 | 4.91 | 14.44 | 19.10 | 21.97 | 15.28 | 70.80 |
| Shahid Afridi | Pak | 359 | 21.99 | 114.6 | 43.86 | 4.61 | 10.99 | 26.27 | 17.10 | 16.26 | 70.63 |
| JH Kallis | Saf | 321 | 37.45 | 73.0 | 39.39 | 4.83 | 18.73 | 16.72 | 19.04 | 15.54 | 70.03 |
| GS Chappell | Aus | 74 | 32.37 | 75.7 | 43.16 | 4.05 | 16.18 | 17.35 | 17.38 | 18.53 | 69.44 |
| CH Gayle | Win | 253 | 35.11 | 84.2 | 44.77 | 4.74 | 17.56 | 19.31 | 16.75 | 15.82 | 69.44 |
| L Klusener | Saf | 171 | 26.10 | 89.9 | 38.19 | 4.70 | 13.05 | 20.61 | 19.64 | 15.94 | 69.24 |
| SR Tendulkar | Ind | 463 | 40.76 | 86.2 | 52.33 | 5.10 | 20.38 | 19.76 | 14.33 | 14.70 | 69.17 |
| A Symonds | Aus | 198 | 31.60 | 92.4 | 44.62 | 5.01 | 15.80 | 21.18 | 16.81 | 14.97 | 68.76 |
| ME Waugh | Aus | 244 | 36.01 | 76.9 | 43.37 | 4.78 | 18.00 | 17.62 | 17.29 | 15.69 | 68.61 |
| Shakib Al Hasan | Bng | 129 | 29.74 | 78.2 | 40.85 | 4.31 | 14.87 | 17.92 | 18.36 | 17.39 | 68.54 |
| N Kapil Dev | Ind | 225 | 19.10 | 95.1 | 44.27 | 3.72 | 9.55 | 21.79 | 16.94 | 20.17 | 68.45 |
| ST Jayasuriya | Slk | 444 | 31.01 | 91.2 | 46.03 | 4.79 | 15.51 | 20.90 | 16.29 | 15.66 | 68.37 |
| RJ Hadlee | Nzl | 115 | 17.86 | 75.5 | 39.12 | 3.31 | 8.93 | 17.30 | 19.17 | 22.69 | 68.09 |
| SM Pollock | Saf | 303 | 17.16 | 86.7 | 39.97 | 3.68 | 8.58 | 19.87 | 18.76 | 20.39 | 67.60 |
The first is the allrounder ratings table. I decided that the batting and bowling functions would get 50% weight each. I could not separate the importance of the two bowling measures. Hence those two get 25% each. However I realised that the Batting scoring rate should be valued marginally higher than the Batting RpI. Most followers would agree with this. The quantum of differential: a simple 10%, leading to an actual differential of just below 20%. So this was 27.5% and 22.5% for the two measures. Arbitrary: Of course, yes. I have no problems with this allocation. If any reader wants a different weight, the Excel sheet contains all measures and the readers can work out their own alternate tables.
It is very difficult to get a high A-R Index. The concerned player would have to be within the top-80% level in each of the four measures. That is what Ryan ten Doeschate has achieved. His numbers are, to say the least, Bradmanesque! In 33 matches, he has scored 1541 runs at an average of 67.00 and captured 55 wickets at an average of 24.13. Individually, these are figures which would put him at the top of the batting tables and the top-15 of the bowling tables. To the sceptics, let me say that he has played eight matches against Test-playing countries and 25 against very tough teams such as Ireland, Kenya and Afghanistan et al. He plays for an average team and does not get as much support as the other big-team players. If he has not played more matches, then that is the problem playing for an associate country. He does not seem to have played in the recent Netherlands-matches. Probably was trying to earn a living. But let us give credit to the best allrounder the world has ever seen: Ryan ten Doeschate of Netherlands.
ten Doeschate is a clear ten points ahead of Andrew Flintoff who has 73.32 points. He has been excellent: 3394 runs at 27.81 and 169 wickets at 24.83 indicate that he has every right to be called the best allrounder ever, only the freakish short-career numbers of ten Doeschate are better. I get the feeling that Flintoff's ODI skills are rather underrated and overshadowed by his Test exploits. Next in the list is Shane Watson. May not be everybody's favourite with his Test woes now but one of the greatest ODI allrounders ever. 4795 runs at 34.25 and 156 wickets at 28.98 illustrate that he is only marginally behind Flintoff. And both these wonderful allrounders have strike rates around 88+.
These are followed by two explosive batsmen but no mean bowlers. Viv Richards must be the most underrated ODI bowler ever. Coming as the fifth bowler, he plundered 118 wickets, albeit at a reasonably high average of 35.83, to go with his 1980s compilation of 6721 runs at 47.83 (and a strike rate of 90.2). A surprise at No.5 is Virender Sehwag. A very much underrated bowler like Richards, he still managed to capture 96 wickets (albeit at 40.14) to go with his 8273 runs at a strike rate exceeding 100. Shahid Afridi is in the eighth place confirming his status as one of the top allrounders ever. And nice to see Kevin O'Brien in the top ten.
| Name | Ctry | ODIs | RpI | Bow-Avge | A-R Ratio |
|---|---|---|---|---|---|
| RN ten Doeschate | Ned | 33 | 48.15 | 24.13 | 1.9957 |
| SR Watson | Aus | 160 | 34.25 | 28.98 | 1.1818 |
| JH Kallis | Saf | 321 | 37.45 | 31.70 | 1.1815 |
| A Flintoff | Eng | 141 | 27.81 | 24.38 | 1.1405 |
| IVA Richards | Win | 187 | 40.24 | 35.83 | 1.1231 |
| GS Chappell | Aus | 74 | 32.37 | 29.12 | 1.1114 |
| DS Lehmann | Aus | 117 | 30.47 | 27.81 | 1.0957 |
| ME Waugh | Aus | 244 | 36.01 | 34.56 | 1.0418 |
| KJ O'Brien | Ire | 72 | 28.89 | 27.93 | 1.0343 |
| Shakib Al Hasan | Bng | 129 | 29.74 | 29.37 | 1.0125 |
| CH Gayle | Win | 253 | 35.11 | 35.38 | 0.9925 |
| SC Ganguly | Ind | 311 | 37.87 | 38.51 | 0.9834 |
| MJ Clarke | Aus | 227 | 35.62 | 37.54 | 0.9490 |
| Imran Khan | Pak | 175 | 24.56 | 26.62 | 0.9226 |
| SR Tendulkar | Ind | 463 | 40.76 | 44.51 | 0.9157 |
| WJ Cronje | Saf | 188 | 31.80 | 34.79 | 0.9141 |
| AR Border | Aus | 273 | 25.88 | 28.37 | 0.9122 |
| L Klusener | Saf | 171 | 26.10 | 29.95 | 0.8714 |
| NJ Astle | Nzl | 223 | 32.67 | 38.46 | 0.8494 |
This is a simpler measure. I divide the Batting RpI by Bowling average to get an Index value. This is my favourite measure and tells a lot about a player's all-round abilities. The ratio is superior to the difference. A player with values of 30 and 25, will have a difference of 5 and a ratio of 1.20. A player with values of 40 and 35 will have the same difference of 5 but a lower ratio of 1.14. It is obvious that the first player is a better allrounder since the lowering of 10 in bowling average is more valuable than the dropping of 10 in batting.
Since this is a performance oriented measure there are some juxtaposition of players at the top from the previous table. Ten Doeschate is at the top with an index value of nearly 2.0, more Bradmanesque than the previous table, since the next value is Watson's 1.18. Jacques Kallis, Flintoff and Richards complete the top-five positions with index values just over 1.12. Watson and Kallis are separated only at the fourth decimal.
| Name | Ctry | ODIs | Runs | Wickets | Equalised value | Per Match |
|---|---|---|---|---|---|---|
| RN ten Doeschate | Ned | 33 | 1541 | 55 | 3301 | 100.0 |
| Shakib Al Hasan | Bng | 129 | 3688 | 161 | 8840 | 68.5 |
| JH Kallis | Saf | 321 | 11498 | 270 | 20138 | 62.7 |
| GS Chappell | Aus | 74 | 2331 | 72 | 4635 | 62.6 |
| A Flintoff | Eng | 141 | 3394 | 169 | 8802 | 62.4 |
| SR Watson | Aus | 160 | 4795 | 156 | 9787 | 61.2 |
| RJ Hadlee | Nzl | 115 | 1751 | 158 | 6807 | 59.2 |
| IK Pathan | Ind | 120 | 1544 | 173 | 7080 | 59.0 |
| IT Botham | Eng | 116 | 2113 | 145 | 6753 | 58.2 |
| L Klusener | Saf | 171 | 3576 | 192 | 9720 | 56.8 |
| IVA Richards | Win | 187 | 6721 | 118 | 10497 | 56.1 |
| HH Streak | Zim | 189 | 2943 | 239 | 10591 | 56.0 |
| Wasim Akram | Pak | 356 | 3717 | 502 | 19781 | 55.6 |
| DJ Bravo | Win | 146 | 2495 | 173 | 8031 | 55.0 |
| Imran Khan | Pak | 175 | 3709 | 182 | 9533 | 54.5 |
| CH Gayle | Win | 253 | 8743 | 157 | 13767 | 54.4 |
| ST Jayasuriya | Slk | 444 | 13430 | 323 | 23766 | 53.5 |
| SM Pollock | Saf | 303 | 3519 | 393 | 16095 | 53.1 |
| CL Cairns | Nzl | 215 | 4950 | 201 | 11382 | 52.9 |
| M Prabhakar | Ind | 130 | 1858 | 157 | 6882 | 52.9 |
This is a measure of the actual performance delivered per match. For this, I valued a bowler wicket at 32 runs. Arbitrary? No way. In the 3403 matches played until 3 August 2013, 42832 wickets were captured by bowlers at a total cost of 1372875 runs. This works to 32.05 RpW. I rounded this to 32. So no one can say this is arbitrary. Of course it has changed over the years. However let me give the readers the following summary.
	1971-1984 281 3469 99425 28.66
	1985-2013 3122 39363 1273450 32.35
So this confirms that for 29 years and for 92% of matches, the average wicket value has been slightly above 32. Just to firm up this number, let me say that, for the period 1985-1989, the average was 32.09.
Ten Doeschate has delivered an equivalent of 100 runs per match. I feel this is one of the most significant figures in the ODI game. A player from an Associate country walked in and delivered the equivalent of a hundred in every match he played. I checked his match performances. He has failed to deliver in either batting or bowling in just two matches out of 33. That means he has delivered in 94% of the matches. I am glad to see the equally talented Shakib Al Hasan in the second position, delivering the equivalent of 68 runs per match. Imagine what these two would have achieved with better support. Then comes the giant, Kallis, with 62.7 runs. Greg Chappell is placed next just behind and then come Flintoff and Watson. Imagine these players guaranteed 60+ runs each time they took the field.
| Name | Ctry | ODIs | Runs | Wickets | Equalised value |
|---|---|---|---|---|---|
| ST Jayasuriya | Slk | 444 | 13430 | 323 | 23766 |
| SR Tendulkar | Ind | 463 | 18426 | 154 | 23354 |
| JH Kallis | Saf | 321 | 11498 | 270 | 20138 |
| Wasim Akram | Pak | 356 | 3717 | 502 | 19781 |
| Shahid Afridi | Pak | 359 | 7303 | 358 | 18759 |
| SM Pollock | Saf | 303 | 3519 | 393 | 16095 |
| WPUJC Vaas | Slk | 324 | 2025 | 400 | 14825 |
| SC Ganguly | Ind | 311 | 11363 | 100 | 14563 |
| SR Waugh | Aus | 325 | 7569 | 195 | 13809 |
| CH Gayle | Win | 253 | 8743 | 157 | 13767 |
| Abdul Razzaq | Pak | 265 | 5080 | 269 | 13688 |
| PA de Silva | Slk | 308 | 9284 | 106 | 12676 |
| CL Hooper | Win | 227 | 5761 | 193 | 11937 |
| N Kapil Dev | Ind | 225 | 3783 | 253 | 11879 |
| Yuvraj Singh | Ind | 282 | 8211 | 112 | 11795 |
| CL Cairns | Nzl | 215 | 4950 | 201 | 11382 |
| V Sehwag | Ind | 251 | 8273 | 96 | 11345 |
| ME Waugh | Aus | 244 | 8500 | 85 | 11220 |
| DL Vettori | Nzl | 275 | 2110 | 284 | 11198 |
| CZ Harris | Nzl | 250 | 4379 | 203 | 10875 |
Now the final table. This is the same table as previous one but ordered on the total match deliveries, in terms of run-equivalence. Sanath Jayasuriya stands on top with 23766 "runs". When we talk of Jayasuriya the destroyer we forget the fact that he also captured 323 wickets. A very canny bowler who averaged 0.75 wickets per match. Sachin Tendulkar, again the 18000+ runs over-shadowing the fact that he also captured over 150 wickets, is close behind. He has 23354 "runs". Then comes Kallis, with 20138 "runs". Now we get two Pakistani giants, Wasim Akram, with 19781 "runs" and Shahid Afridi, with 18759 "runs". This is a tribute to the longevity of these outstanding allrounders.
| Name | Ctry | ODIs | RpI-Idx | Sc/R-Idx | Batting Index | St/R-Idx | RpO-Idx | Bowling Index | Ratio |
|---|---|---|---|---|---|---|---|---|---|
| WPUJC Vaas | Slk | 324 | 4.60 | 16.62 | 21.2 | 19.02 | 17.90 | 36.9 | 0.57 |
| RJ Hadlee | Nzl | 115 | 8.93 | 17.30 | 26.2 | 19.17 | 22.69 | 41.9 | 0.63 |
| M Prabhakar | Ind | 130 | 9.48 | 13.85 | 23.3 | 18.52 | 17.54 | 36.1 | 0.65 |
| Wasim Akram | Pak | 356 | 6.64 | 20.24 | 26.9 | 20.71 | 19.25 | 40.0 | 0.67 |
| Mudassar Nazar | Pak | 122 | 11.53 | 12.00 | 23.5 | 17.15 | 17.68 | 34.8 | 0.68 |
| ... | |||||||||
| CL Hooper | Win | 227 | 13.98 | 17.56 | 31.5 | 15.12 | 17.20 | 32.3 | 0.98 |
| SB Styris | Nzl | 188 | 13.92 | 18.20 | 32.1 | 16.79 | 15.81 | 32.6 | 0.99 |
| Shoaib Malik | Pak | 216 | 14.22 | 17.94 | 32.2 | 15.62 | 16.50 | 32.1 | 1.00 |
| GW Flower | Zim | 221 | 15.35 | 15.49 | 30.8 | 14.29 | 16.16 | 30.4 | 1.01 |
| WJ Cronje | Saf | 188 | 15.90 | 17.53 | 33.4 | 15.96 | 16.88 | 32.8 | 1.02 |
| ... | |||||||||
| A Symonds | Aus | 198 | 15.80 | 21.18 | 37.0 | 16.81 | 14.97 | 31.8 | 1.16 |
| TM Dilshan | Slk | 267 | 15.79 | 19.74 | 35.5 | 12.92 | 15.97 | 28.9 | 1.23 |
| IVA Richards | Win | 187 | 20.12 | 20.67 | 40.8 | 15.68 | 16.69 | 32.4 | 1.26 |
| V Sehwag | Ind | 251 | 16.88 | 23.91 | 40.8 | 16.39 | 14.25 | 30.6 | 1.33 |
| SR Tendulkar | Ind | 463 | 20.38 | 19.76 | 40.1 | 14.33 | 14.70 | 29.0 | 1.38 |
This is a quirky report. I have divided the batting rating total points by the bowling rating total points. This ratio reveals the nature of the player's all-round abilities: ranging from bowlers who could bat through genuine allrounders to the batsmen who could bowl. The first five belong to the bowling allrounders classification. One surprise there! Chaminda Vaas, Richard Hadlee, Manoj Prabhakar and Wasim Akram were top bowlers first and their batting skills were only add-ons. However Mudassar Nazar is a surprise. My conclusion is that, for a batsman, his batting numbers are quite average.
The middle five, either side of a ratio 0f 1.00, are here only because of the way the numbers fell. Shoaib Malik is the only allrounder whose batting total matches the bowling total exactly. The others are all good allrounders.
The third group is quite clear. All five were far superior batsmen than bowlers. Jayasuriya does not appear here because his bowling numbers are quite impressive.
Finally, who do I salute? I will doff my imaginary hat at ten Doeschate, Flintoff, Watson, Jayasuriya and Afridi, in that order. I will end with an additional salute to ten Doeschate.
I have created an Excel sheet with complete details for these 65 players. To download/view the document, please CLICK HERE.
One final comment on ten Doeschate. He can only play the cards dealt to him. Since he made his debut and got a permanent place, Netherlands have played 50-odd matches. As I have mentioned before, he missed playing the last few matches for his country. So 33 matches in six years is the limit for a player like him. Anyhow if any reader does not want to consider Tendo, he only has to take off the top entry in the relevant tables.
To round off the article I have given below what I feel, based on a number of relevant objective measures, the five greatest all-round performances ever in ODI matches.
1. Shahid Afridi's 76 and 7 for 12 against West Indies during 2013. That an all-round performance contains the second best bowling spell ever speaks volume of this superb effort. And not to forget that the 76, made out of a middling total of 224 for 9, and a recovery from 47 for 5, was itself a truly match-winning effort.
2. Scott Styris' 63 and 6 for 25 against West Indies during 2002. This was a low scoring and close match. New Zealand scored 212, mainly due to Styris lovely innings late in the order. Then he captured 6 for 25 to restrict West Indies to 202 for 9. I would say this performance is only bettered by Afridi's recent effort.
3. Richards' 119 and 5 for 41 against New Zealand during 1987. Until Paul Collingwood's effort this remained a unique effort. Richards' 119 comprised of more than 50% of his team total. The next highest score was 48. Four of his five wickets were of top order batsmen.
4. Paul Collingwood's 112 and 6 for 31 against Bangladesh during 2005. Granted that this was against Bangladesh but let us not forget that no one has scored a century and captured 6 wickets in a match.
5. Tendulkar's 141 and 4 for 38 against Australia during 1998. This was a big innings and the four late order wickets arrested Australia push towards a win. This was also the quarter-final of the Wills International Cup.
My next article will again be the first of a kind. I will apply the ball-by-ball data to a single event, in this case the Ashes series, and come out with the highlights of head-to-head confrontations.
Anantha Narayanan has written for ESPNcricinfo and CastrolCricket and worked with a number of companies on their cricket performance ratings-related systems